目录
业务背景
系统监控发展历程
技术方案
日志监控技术方案
Grafana 阿里云SLS日志服务
分布式链路追踪技术方案
阿里云jaeger
开源框架skywalking
监控技术方案
SpringBoot Actuator Jolokia Telegraf Influxdb Grafana
Springboot SpringbootAdmin
Springboot SOFA-Lookout Prometheus Grafana
SpringBootActuator Prometheus Grafana
业务背景
随着互联网行业的迅速发展,用户增长越来越快,为了保证用户的体验,对产品的性能和产品的体验越来越高,产品的迭代速度越来越快,为了保证用户的体验感和了解用户的需求,一个全过程、规范化、自动化、智能化的监控管理管理系统非常迫切。
为了更好、更有效的保障系统上线后的稳定的运行。对于服务器的硬件资源、性能、带宽、端口、进程、服务等都必须有一个可靠和可持续的监测机制,统计分析每天的各种数据,从而能及时反映出服务器哪里存在性能瓶颈、安全隐患等。另外是要有危机意识,就是了解服务器有可能出现哪些严重的问题,出现这些问题后该如何去迅速处理。比如数据库的数据丢失,日志容量过大,被黑客入侵等等。
平台的设计要求
监控平台上实现对系统运行状态的集中管理(主要包含服务器、网络、数据库、中间件、操作系统、应用软件),具体体现在:
1、服务器资源分析,实现服务器CPU、内存、磁盘、网络出入流量等指标监控管理;
2、操作系统分析, 实现操作系统的进程、线程、TCP等指标管理
3、数据库、中间件、应用系统分析, 实现可用性监控管理
4、应用系统的链路跟踪分析,实现业务故障的快速定位
系统监控发展历程
日志监控阶段
本阶段实现中间件、应用系统的运行日志的采集和存储,提供搜索功能,通过日志来进故障排查。
链路监控阶段
指标监控阶段
链路监控对自定义指标支持的比较弱,也无法实现或者展现更加多样的查询聚合需求。
本阶段的实现支持丰富的Metric指标,将链路上的一些报表数据也可以划分到指标中,交给专业的时序数据库来做指标的存储和查询,对接或者自研丰富的指标看板。针对指标进行更加丰富的告警策略与故障排查,一旦有告警,可能需要到各个系统上查看指标看板,粗略定位根因,再结合链路总和分析。
深度分析阶段
指标监控虽然可以在一个系统中看到所有各个层面的监控数据了,但是每次排障时仍然要花很多的时间去查看各个层面是否有问题,一旦漏看一项可能就错过了问题所在的根因没有整个业务的全局监控视角,都停留在各自应用的角度。用户查询什么指标就展示相应的数据,并不去关心用户所存储数据的内容。本阶段需要主动去帮用户分析存储的数据内容,帮助用户结合业务的需求和数据结构,进行模型抽象,为用户构建应用大盘和业务大盘,提供准确的数据,并做相关业务的分析。
应用大盘:就是为当前应用构建上下游应用依赖的监控、当前应用所关联的机器监控、中间件、数据库等监控,可以时刻为应用做体检,来主动暴露出问题,而不是等用户去一个个查指标而后发现问题。
业务大盘:就是根据业务来梳理或者利用链路来自动生成大盘,该大盘可以快速告诉用户是哪些业务环节出的问题。
趋势报表分析:主动帮用户发现一些逐渐恶化的问题点,比如用户发布之后,接口耗时增加,很可能用户没有发现,虽然当前没有问题,但是很有可能在明天的高峰期就会暴露问题。
告警方式:可以统一的针对各个层面的监控数据做统一化的告警。
技术方案日志监控技术方案Grafana 阿里云SLS日志服务
图片来自阿里云 https://yq.aliyun.com/articles/227006
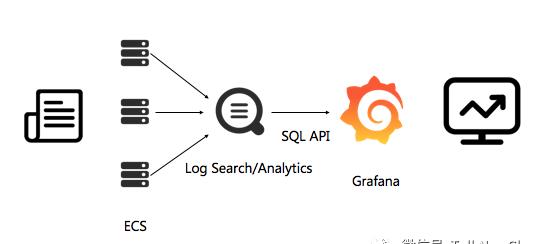
采集端:Logtail采集 日志服务快速入门 https://helpcdn.aliyun.com/document_detail/54604.html?spm=a2c4g.11186623.6.574.6d556cc3n7eQ2X
接收端:阿里云SLS日志服务
展示端:Grafana
Grafana集成SLS日志服务,需要安装插件,通过插件配置SLS数据源,详情请参阅 https://yq.aliyun.com/articles/227006
支持数据源:应用程序的程序输出 ,访问日志 ,中间件日志、数据库日志
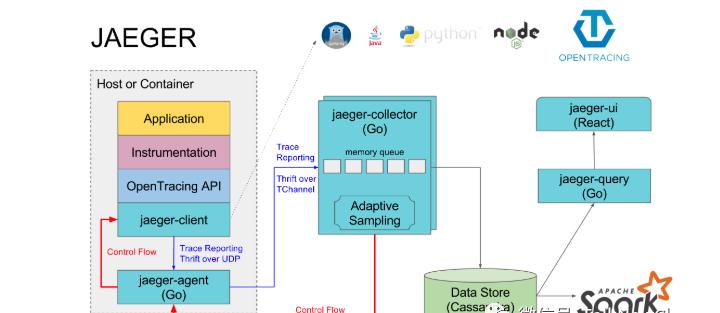
分布式链路追踪技术方案阿里云jaeger方案
开源框架skywalking
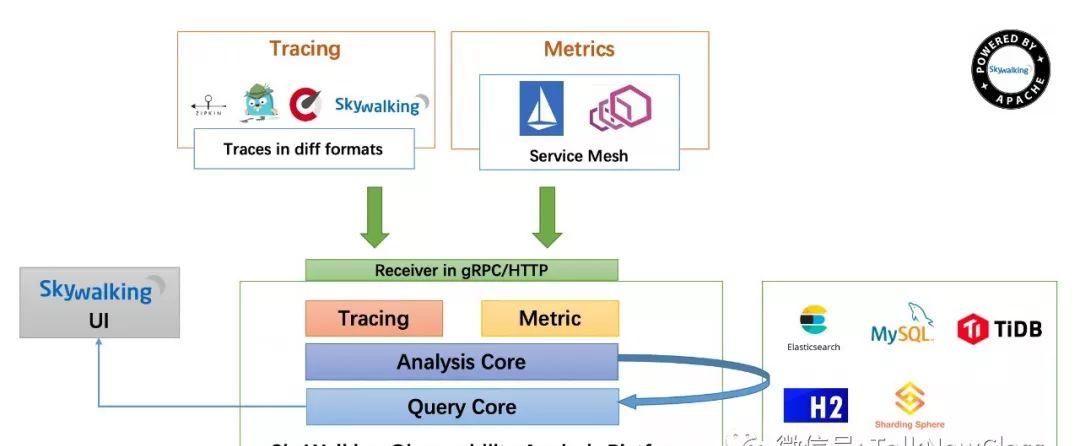
skywalking部署有2种方式:
独立部署:可以在每个应用机器上单独部署agent代理,请参阅 https://github.com/apache/skywalking/tree/master/docs
应用程序集成:另外一种是与springboot、Springcloud集成,详情请阅读 https://www.jianshu.com/p/e81e35dc6406
指标监控技术方案SpringBoot Actuator Jolokia Telegraf Influxdb Grafana 方案
Actuator
actuator是spring boot提供的对应用系统的自省和监控的集成功能,可以对应用系统进行配置查看、相关功能统计等。
Jolokia
Spring Boot Actuator对外暴露应用的监控信息,Jolokia提供使用HTTP接口获取JSON格式 的数据。
Telegraf
收集系统和服务的统计数据,并支持写入到 InfluxDB 数据库。
Telegraf 详情,请参阅 https://www.influxdata.com/
创建spring-boot-monitoring 工程
配置 pom.xml
<dependency> <groupId>org.jolokia</groupId> <artifactId>jolokia-core</artifactId> <version>2.0.0</version> </dependency> <dependency> <groupId>org.springframework.boot</groupId> <artifactId>spring-boot-starter-actuator</artifactId> <version>2.0.0</version> </dependency>
配置 application.properties
spring.application.name=spring-boot-monitoringmanagement.endpoints.jmx.enabled=truemanagement.jolokia.enabled=truemanagement.jolokia.config.debug=true
telegraf配置
[[inputs.jolokia]]context = “/actuator/jolokia/read/”[[inputs.jolokia.servers]] name = “spring-boot-monitoring” host = “127.0.0.1” port = “8080”[[inputs.jolokia.metrics]] name = “heap_memory_usage” mbean = “java.lang:type=Memory” attribute = “HeapMemoryUsage”[[inputs.jolokia.metrics]] name = “thread_count” mbean = “java.lang:type=Threading” attribute = “TotalStartedThreadCount,ThreadCount,DaemonThreadCount,PeakThreadCount”[[inputs.jolokia.metrics]] name = “class_count” mbean = “java.lang:type=ClassLoading” attribute = “LoadedClassCount,UnloadedClassCount,TotalLoadedClassCount”[[inputs.jolokia.metrics]] name = “metrics” mbean = “org.springframework.boot:name=metricsEndpoint,type=Endpoint” attribute = “Data”[[inputs.jolokia.metrics]] name = “tomcat_max_threads” mbean = “Tomcat:name=\”http-nio-8080\”,type=ThreadPool” attribute = “maxThreads”[[inputs.jolokia.metrics]] name = “tomcat_current_threads_busy” mbean = “Tomcat:name=\”http-nio-8080\”,type=ThreadPool” attribute = “currentThreadsBusy” [[outputs.influxdb]] ## The full HTTP or UDP URL for your InfluxDB instance. ## ## Multiple urls can be specified as part of the same cluster, ## this means that only ONE of the urls will be written to each interval. # urls = [“udp://localhost:8089”] # UDP endpoint example urls = [“http://localhost:8086”] # required ## The target database for metrics (telegraf will create it if not exists). database = “telegraf” # required
Influxdb
InfluxDB 是一个开源分布式时序、事件和指标数据库。它具备如下主要特性;
Time Series (时间序列):你以使用与时间有关的相关函数(如最大,最小,求和等)
Metrics(度量):你可以实时对大量数据进行计算
Eevents(事件):它支持任意的事件数据
介绍与SQL语法、常用命令使用方法
https://www.influxdata.com/
Grafana
Grafana安装与使用
https://grafana.com/docs/grafana/latest/installation/
Springboot Springboot admin方案
Spring Boot Admin
Spring Boot Admin 是一个管理 和监控 Spring Boot 应用程序 的一款开源软件。Spring Boot Admin 分为 Server 端和 Client 端,Spring Boot Admin UI 部分使用 AngularJS 将数据展示在前端。
功能如下:
显示 name/id 和版本号
显示在线状态
Logging 日志级别管理
JMX beans 管理
Threads 会话和线程管理
Trace 应用请求跟踪
应用运行参数信息,如:Java 系统属性、Java 环境变量属性、内存信息、Spring 环境属性
创建SpringBootAdminServer工程
添加依赖pom.xml
<dependency> <groupId>de.codecentric</groupId> <artifactId>spring-boot-admin-server</artifactId> <version>2.1.1</version></dependency><dependency> <groupId>de.codecentric</groupId> <artifactId>spring-boot-admin-server-ui</artifactId> <version>2.1.1</version></dependency>
SpringBootAdminApplication 类 添加@EnableAdminServer注解
@SpringBootApplication@EnableAdminServerpublic class SpringBootAdminApplication { public static void main(String[] args) { SpringApplication.run(SpringBootAdminWebApplication.class, args); }}
在application.properties文件中添加如下配置
spring.application.name=admin-serverserver.port=8769
创建SpringBootAdminClient工程
添加依赖pom.xml
<dependencies> <dependency> <groupId>org.springframework.boot</groupId> <artifactId>spring-boot-starter-web</artifactId> <version>2.1.1</version> </dependency> <dependency> <groupId>de.codecentric</groupId> <artifactId>spring-boot-admin-starter-client</artifactId> <version>2.1.1</version> </dependency></dependencies>
添加配置项 application.properties
spring.application.name=admin-clientserver.port=8768spring.boot.admin.client.url=http://localhost:8769management.endpoints.web.exposure.include=*management.endpoint.health.show-details=always
启动adminserver与adminclient工程
Springboot SOFA-Lookout Prometheus Grafana方案
SOFAStack
ScalableOpenFinancialArchitecture Stack 是蚂蚁金服自主研发的金融级分布式架构,包含了构建金融级云原生架构所需的各个组件,是在金融场景里锤炼出来的最佳实践。
SOFALookout 是蚂蚁金服在 SOFAStack 体系内研发开源的一款解决系统的度量和监控问题的轻量级中间件服务。本文给大家介绍下 SOFALookout 服务器端主要提供的特性以及使用方式。
SOFALookout:https://github.com/sofastack/sofa-lookout
springboot工程
pom.xml 引入jar
<dependency> <groupId>com.alipay.sofa.lookout</groupId> <artifactId>lookout-sofa-boot-starter</artifactId> <version>1.5.2</version> </dependency> <dependency> <groupId>com.alipay.sofa.lookout</groupId> <artifactId>lookout-reg-prometheus</artifactId> <version>1.5.2</version> </dependency>
配置文件指定SOFALookout 暴露端口
spring.application.name=springboot2_sofa_lookoutcom.alipay.sofa.lookout.prometheus-exporter-server-port=8081
Prometheus需要配置一下刚刚SOFA-Lookout的端口,如下:
– job_name: ‘springboot2_sofa_lookout’ scrape_interval: 5s static_configs: – targets: [‘localhost:8081’]
granafa 配置Prometheus数据源,定制 Dashboard
https://gitee.com/dalaoyang/springboot_learn/tree/master/springboot2_sofa_lookout
SpringBoot Actuator Prometheus Grafana 方案
添加依赖
<dependency> <groupId>io.micrometer</groupId> <artifactId>micrometer-registry-prometheus</artifactId></dependency>
启动端点
启用 /actuator/prometheus 端点,供 Prometheus 来抓取指标
management: endpoints: web: exposure: include: health,info,env,metrics,prometheus
启动 SpringBoot 服务 查看 /actuator/prometheus
# HELP jvm_gc_max_data_size_bytes Max size of old generation memory pool# TYPE jvm_gc_max_data_size_bytes gaugejvm_gc_max_data_size_bytes 1.395654656E9…
配置Prometheus 通过/actuator/prometheus 端点来抓取数据
prometheus.yml
# my global configglobal:scrape_interval: 15s # Set the scrape interval to every 15 seconds. Default is every 1 minute.evaluation_interval: 15s # Evaluate rules every 15 seconds. The default is every 1 minute.# scrape_timeout is set to the global default (10s).# Alert manager configurationalerting:alertmanagers:- static_configs: – targets: # – alertmanager:9093# Load rules once and periodically evaluate them according to the global ‘evaluation_interval’.rule_files:# – “first_rules.yml”# – “second_rules.yml”scrape_configs:- job_name: ‘prometheus’ static_configs: – targets: [‘localhost:9090’]- job_name: ‘spring’ metrics_path: ‘/actuator/prometheus’ static_configs: – targets: [‘localhost:8077’]
思考题
上述方案的优缺点,如何改进,改进后的适合的对应场景是什么?
通过本文的学习,让你对系统监控有个宏观上的认识和了解,实现的方案很多,具体选择和落实需要扎实的功夫。
后续会持续更新,提供更详细的参考方案和github的源码。